HEED: Home Energy Efficient Design

HEED Overview Tutorial (~20 min.)
(Also available in Spanish)
HEED Basic Design Tutorial (~30 min.)
(Also available in Spanish)
HEED Advanced Design Tutorial (~37 min.)
(Also available in Spanish)
SBEED: Small Building Energy Efficient Design

CLIMATE CONSULTANT

The purpose is not simply to plot climate data, but rather to organize and represent this information in easy-to-understand ways that show the subtle attributes of climate, and its impact on built form. The goal is to help users create more energy efficient, more sustainable buildings, each of which is uniquely suited to its particular spot on this planet.
The Psychrometric Chart shown to the left is one of the more advanced features available in Climate Consultant. Each dot on the chart represents the temperature and humidity of each of the 8760 hours per year. Different Design Strategies are represented by specific zones on this chart. The percentage of hours that fall into each of the 16 different Design Strategy Zones gives a relative idea of the most effective passive heating or passive cooling strategies. Climate Consultant analyzes the distribution of this psychrometric data in each Design Strategy zone in order to create a unique list of Design Guidelines for a particular location.
If you wish to work with the full desktop or laptop version of Climate Consultant, select the appropriate installation version on the download page:
Climate Consultant Download Page
Climate Consultant Overview Tutorial (~10 min.) authored by Carmen Trudell
Climate Consultant Advanced Tutorial (~12 min.) authored by Carmen Trudell
PSYCHROMETRIC CHART TUTORIAL
Psychrometric Chart Tutorial (~4 min.) authored by Yasmin Bhattacharya
CLIMATE DATA
Additional Climate Data files for HEED, SBEED, Climate Consultant, and Opaque can also be manually downloaded in EPW format from these other web sites (see READ-EPW (Manually) for installation instructions):
- climate.onebuilding.org offers over 10,000 free EPW stations.
- weather.whiteboxtechnologies.com lists over 10,000 files.
The users manual and data format information for EPW weather data files can be downloaded for the Energy Plus web site under the View Format Definition tab.
OPAQUE 3 (New Release, March 2017)

SOLAR-2
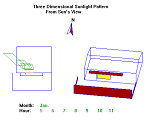
CAUTION: Treat this version of SOLAR2 as a DEMO only because the New Installer created December 2016 seems to be unable to accept new design data input. We are working to correct it and will post a revision as soon as possible (generation 4 released July, 1999, original release Sept., 1987) [over 10,000 downloads since Feb., 1999]
Plots sunlight penetrating through a window with any combination of rectangular fins and overhangs. Also plots hour-by-hour 3-D suns-eye view movie of the building wall. Prints annual tables of percent of window in full sun, radiation on glass, etc. NOTE: Many of its functions have also been added to HEED, SBEED, and Climate Consultant.
A Course in CLIMATE RESPONSIVE BUILDING DESIGN
ENERGY DESIGN TOOLS USERS MANUALS BIBLIOGRAPHY
TECHNICAL PAPERS BIBLIOGRAPHY
THESES
DESIGN TO SURVIVE WILDFIRES
RESIDENTIAL WATER CONSERVATION (480 pages, PDF)
RESIDENTIAL WATER RE-USE (560 pages, PDF)